Mi 14 April 2021 | tags: software, -- (permalink)
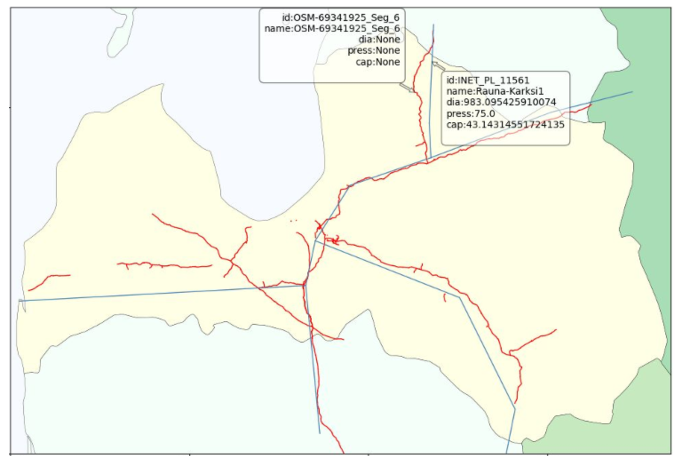
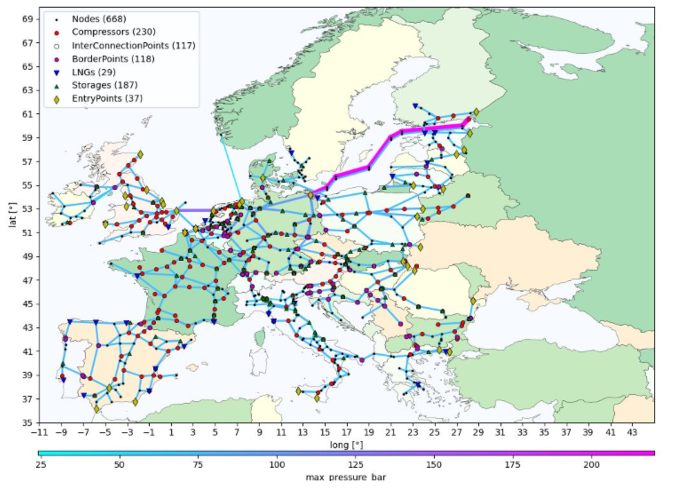
We are happy to announce the release of qplot a python library to visualize SciGRID_gas data.
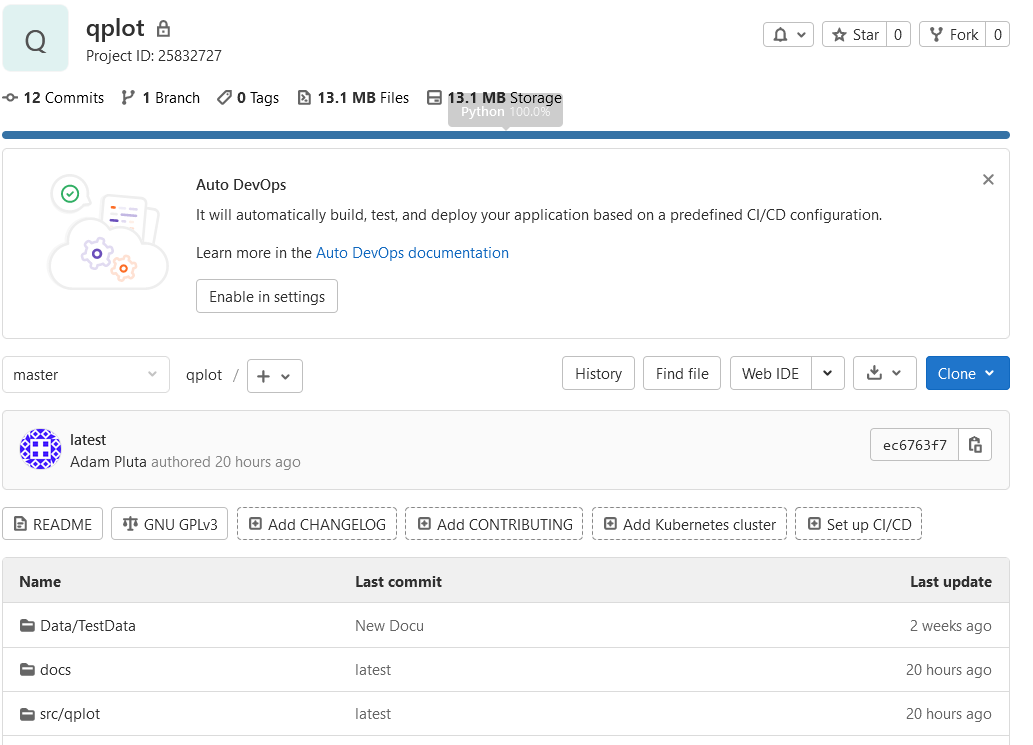
The software is available from our gitlab repository.
You can find the documentation here.
Mi 14 April 2021 | tags: software, -- (permalink)
We are happy to announce the release of qplot a python library to visualize SciGRID_gas data.
The software is available from our gitlab repository.
You can find the documentation here.